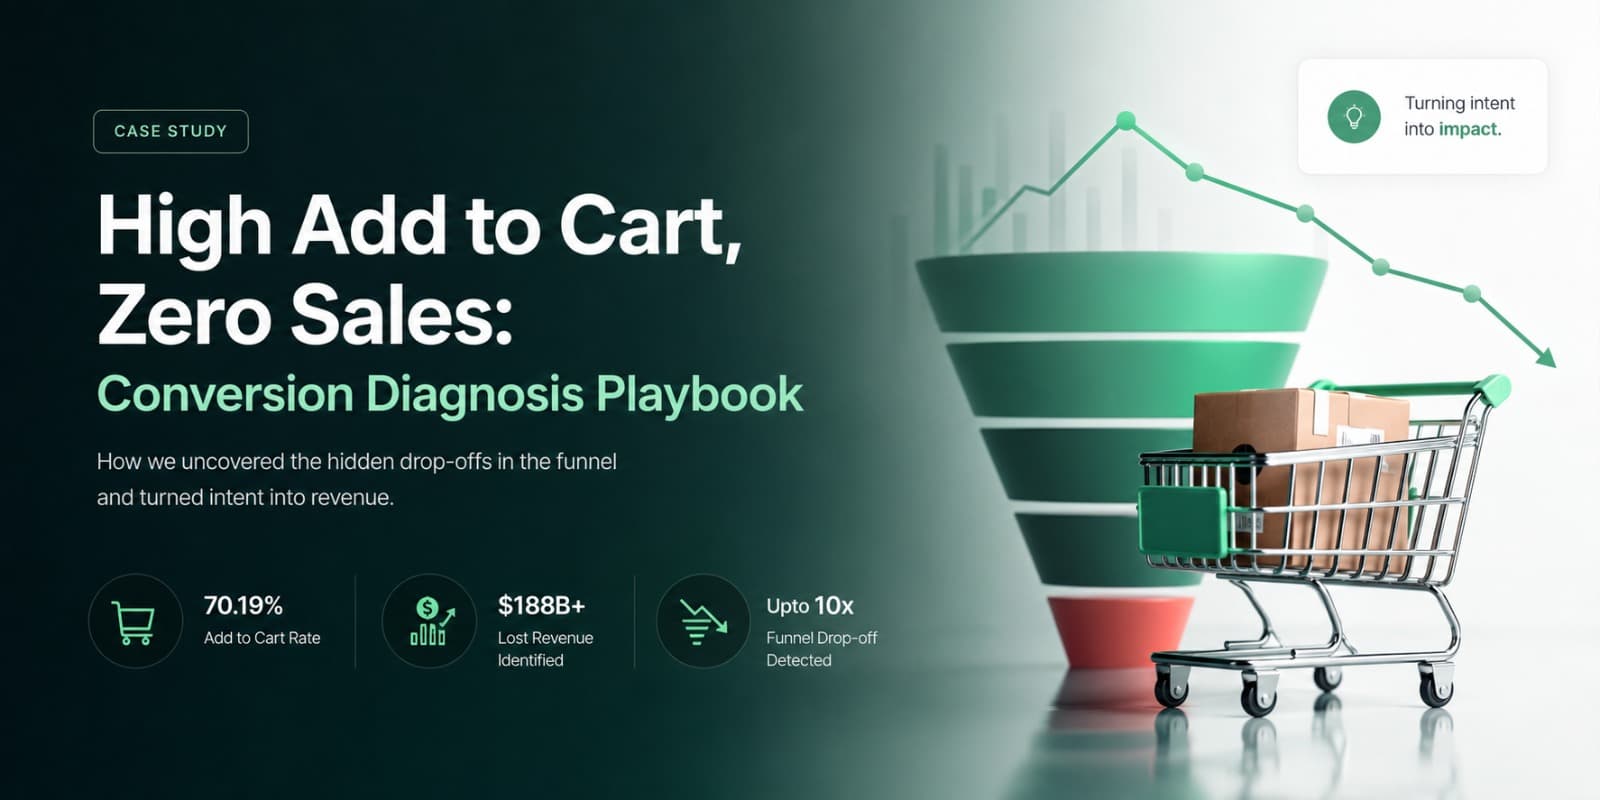
Why shoppers want your product but still do not buy.
Key Market Numbers
70.19%
Average global cart abandonment rate
$18B+
Lost annually to cart abandonment
5-10x
Cheaper to recover abandoners than acquire new leads
Section 1: Understanding the Metric
1.1 What Exactly Does Add to Cart Mean?
Add to Cart (ATC) is a micro-conversion event — a measurable action showing that a shopper has moved from casual browsing into active product consideration. It is not a purchase signal, but rather an intent signal.
| The Three Layers of ATC Intent | |
|---|---|
| 1. Behavioral Layer | The shopper clicks the ATC button — a low-commitment physical action requiring only a moment of attention. |
| 2. Psychological Layer | The customer mentally shortlists the product over alternatives. The product has entered their decision-making process. |
| 3. Commercial Layer | The product now sits inside the customer’s personal cart space, creating a sense of partial ownership. This relates to the psychological concept called the Endowment Effect. |
The ATC button represents the exact transition point between desire and purchase decision. What happens after this click determines whether interest becomes revenue.
1.2 Key Metrics You Must Track Alongside ATC
ATC alone has little meaning unless evaluated together with supporting metrics.
| Metric | Formula | What It Measures |
|---|---|---|
| ATC Rate | ATCs / Sessions × 100 | How attractive and persuasive product pages are |
| Cart Abandonment Rate | (1 - Purchases / ATCs) × 100 | Where customer intent breaks down |
| Checkout Abandonment Rate | 1 - Orders / Checkouts Initiated | Checkout friction and trust issues |
| ATC-to-Purchase Ratio | Purchases / ATCs | Conversion efficiency after intent |
| Repeat ATC Rate | Users who ATC across multiple sessions | Price sensitivity and consideration cycles |
| Average Time to Purchase | ATC Timestamp -> Purchase Timestamp | Length of buyer decision cycle |
| Cart Recovery Rate | Recovered Carts / Abandoned Carts | Effectiveness of remarketing and recovery flows |
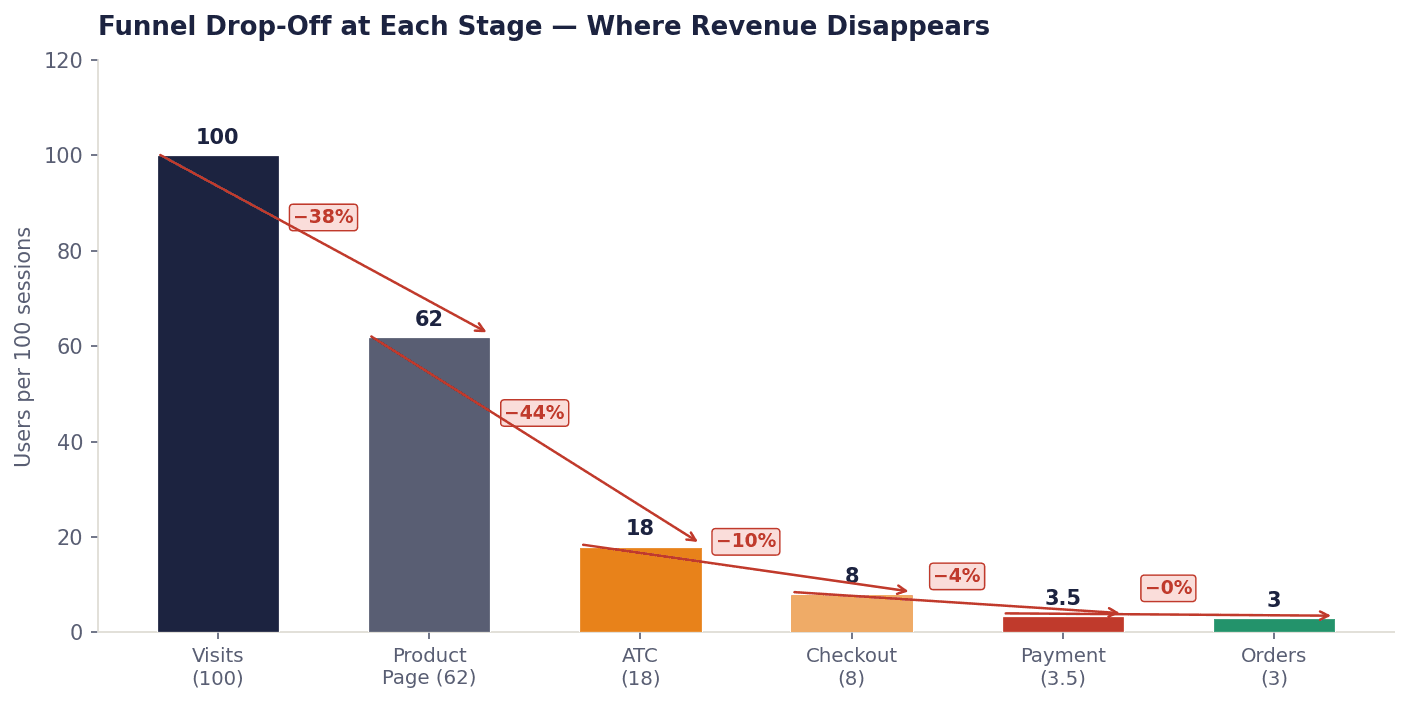
The purchase funnel is not a smooth slide. It is a series of gates, each with a different type of friction. Identifying where users exit tells you exactly what to fix.
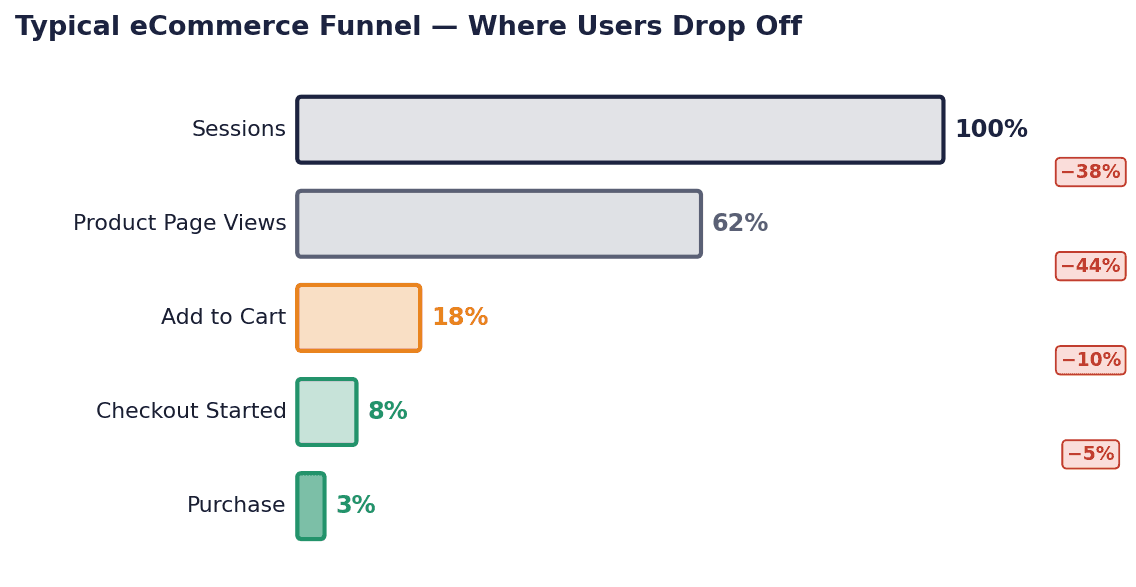
| Funnel Stage | Avg. Drop Rate | Primary Cause | Diagnostic Signal |
|---|---|---|---|
| Landing Page → Product Page | 40–60% | Poor first impression, slow load, irrelevant traffic | High bounce rate on landing page |
| Product Page → ATC | 60–80% | Weak product content, pricing concern, trust gap | Low ATC rate (<3%) |
| ATC → Checkout Start | 20–30% | Price shock (shipping), cart confusion, distraction | Cart abandonment before checkout init |
| Checkout Start → Payment | 50–70% | UX friction, account requirement, form overload | High checkout abandonment rate |
| Payment → Confirmation | 10–20% | Payment failure, security concern, timeout | Payment failure rate in gateway logs |
Section 2: What High ATC Signals
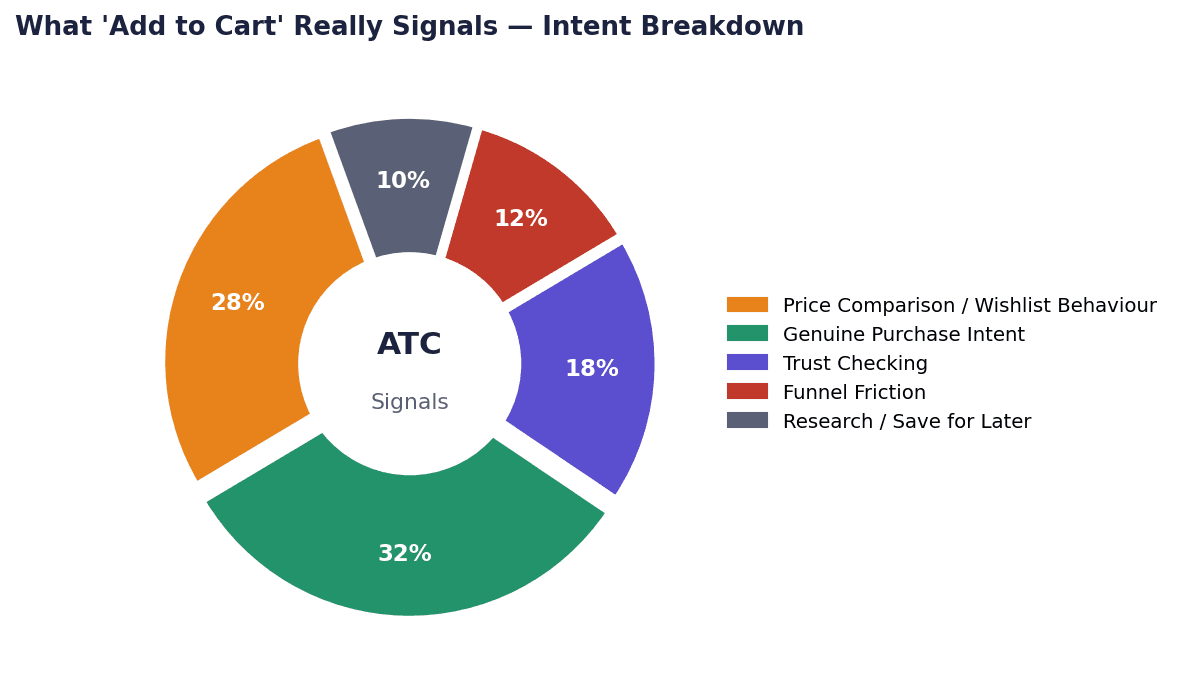
A high ATC rate can indicate strong demand, but it can also expose friction after intent.
Section 8: Scaling Implications
| Signal | What It Actually Means |
|---|---|
| Product-Market Desire | People want what you sell. Targeting and offer resonance are working. |
| Price Uncertainty | Users add to cart to compare total cost including shipping and fees. |
| Wishlist Behaviour | Users use cart as save-for-later when wishlist tools are missing. |
| Trust Deficit | Product interest exists, but brand/payment trust is weak. |
| Funnel Friction | Checkout flow creates drop-offs among otherwise ready buyers. |
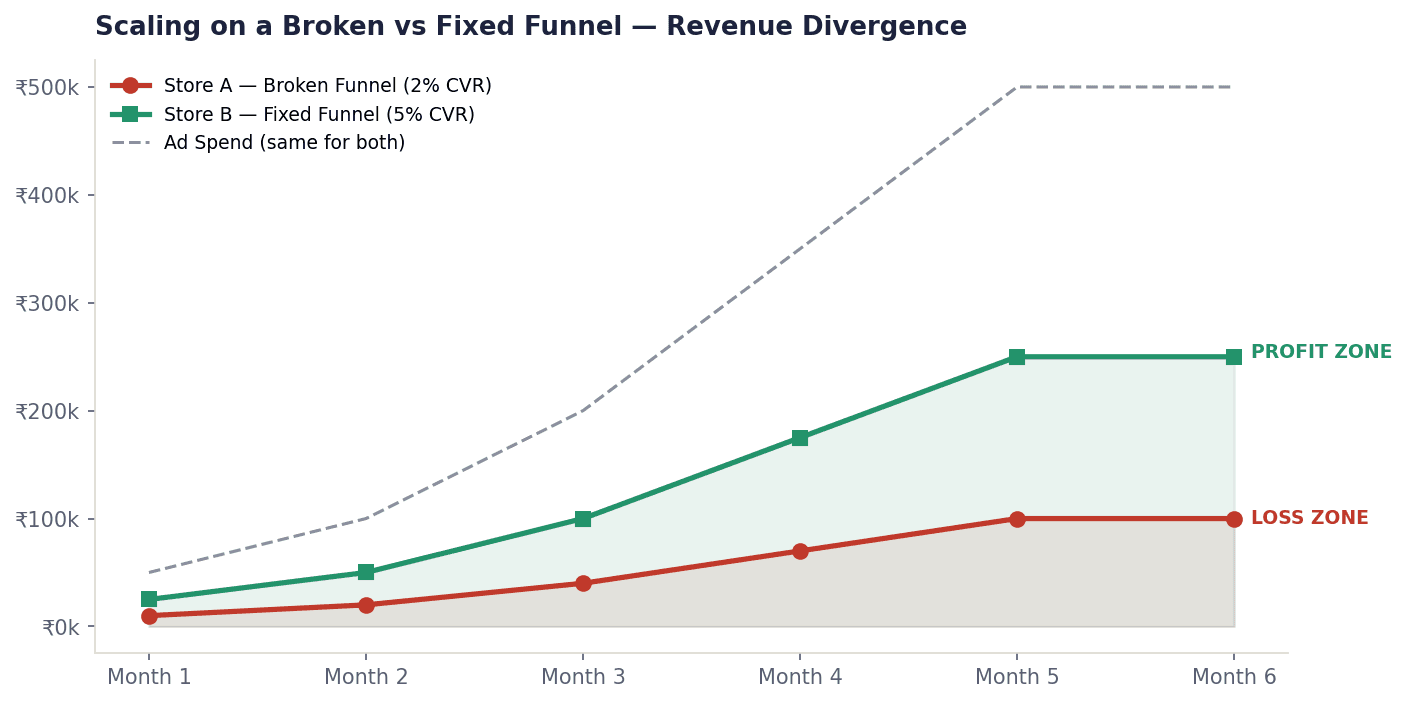
The ATC-to-no-sale problem does not stay small. It compounds dangerously as you scale. Here is what happens to a business that ignores this gap:
8.1 The Scaling Death Loop
What Happens When You Scale on a Broken Funnel
Month 1: You spend Rs. 50,000 on ads -> 500 ATCs -> 10 sales -> 2% conversion rate. "Let me scale."
Month 2: You spend Rs. 2,00,000 on ads -> 2,000 ATCs -> 40 sales -> same 2% rate. Acquisition cost unchanged.
Month 3: Ad fatigue sets in, CPCs rise. You spend Rs. 5,00,000 -> 2,200 ATCs -> 38 sales -> 1.7% rate.
Month 4: You are losing money per sale. The funnel leak was always there. Scaling made it catastrophic.
Lesson: Fix conversion rate before scaling ad spend. A 4% CR is worth roughly 2x more than a 2% CR.
8.2 Unit Economics Impact
Consider two stores with identical ad spend and ATC rates but different checkout conversion rates:
| Metric | Store A (Broken Funnel) | Store B (Fixed Funnel) |
|---|---|---|
| Monthly Ad Spend | Rs. 1,00,000 | Rs. 1,00,000 |
| Sessions Generated | 10,000 | 10,000 |
| ATC Rate | 5% | 5% |
| Total ATCs | 500 | 500 |
| ATC-to-Purchase Rate | 2% | 5% |
| Total Orders | 10 | 25 |
| Avg. Order Value | Rs. 2,000 | Rs. 2,000 |
| Total Revenue | Rs. 20,000 | Rs. 50,000 |
| ROAS | 0.2x (LOSS) | 0.5x |
| Revenue if Ad Spend Doubled | Rs. 40,000 | Rs. 1,00,000 |
Same product. Same ads. Same traffic. The only difference is the funnel. Store B generates 2.5x more revenue from the same spend. At scale, this is the difference between a profitable business and a failing one.
Section 3: Good ATC vs. Bad ATC
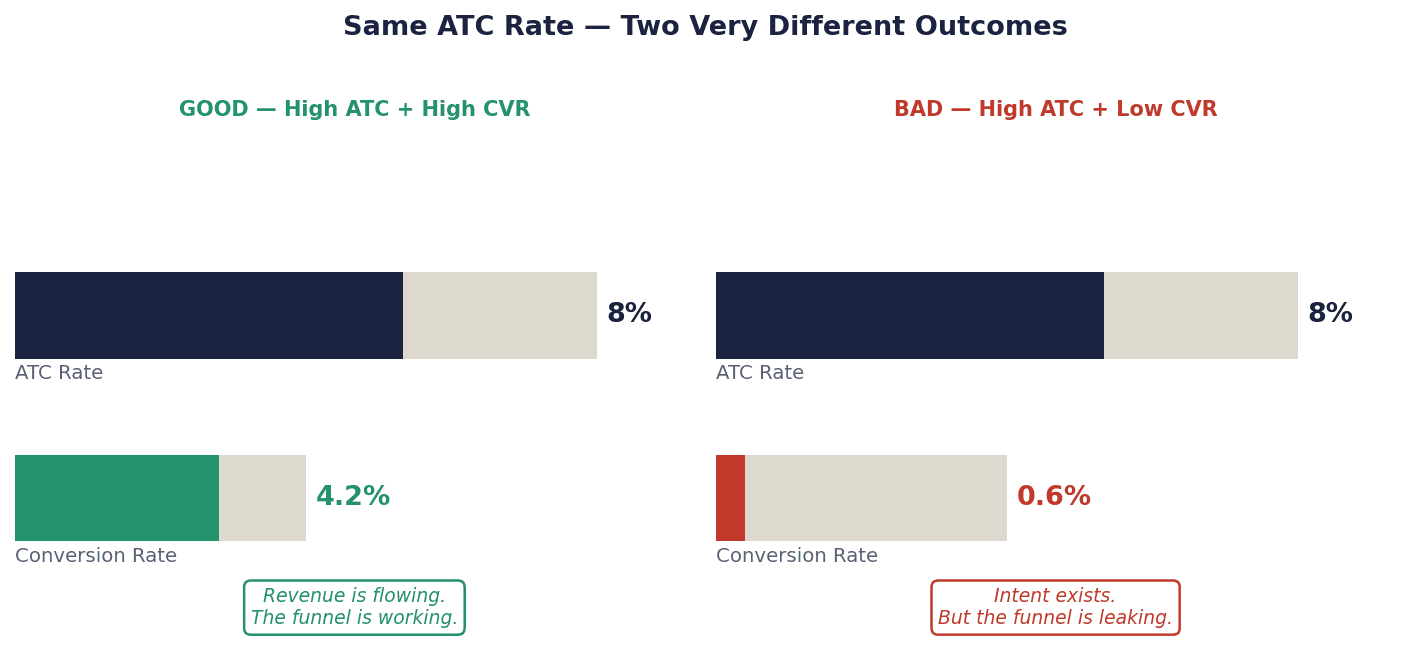
Not all high ATC rates are problems. Context is everything. Here is how to distinguish a healthy ATC pattern from a dangerous one:
| GOOD ATC Scenario | BAD ATC Scenario |
|---|---|
| ATC rate is high AND conversion rate is above industry benchmark (2–4%) | ATC rate is high BUT conversion rate is below 1% |
| High ATC on a new product launch — signals product validation | High ATC on core products with zero sales over 30+ days |
| ATC spikes before major sales events (Black Friday, Diwali) — shoppers saving carts to buy when discount drops | ATC rate is high but cart value never changes — users abandon before checkout begins |
| ATC from repeat customers who know your brand and return to complete | High ATC from cold traffic with no brand familiarity — trust was never built |
| ATC is high and email recovery sequences convert 5–15% of abandoners | ATC is high but recovery emails are unopened / not set up at all |
| Seasonal high ATC with predictable purchase completion the next day | Steady high ATC month-over-month with declining purchases — a worsening leak |
| High ATC for a low-cost impulse product — most users complete quickly | High ATC for a high-ticket item with no financing option, no trust badges, no reviews |
Section 9: Real-World Scenarios
The Key Diagnostic Question
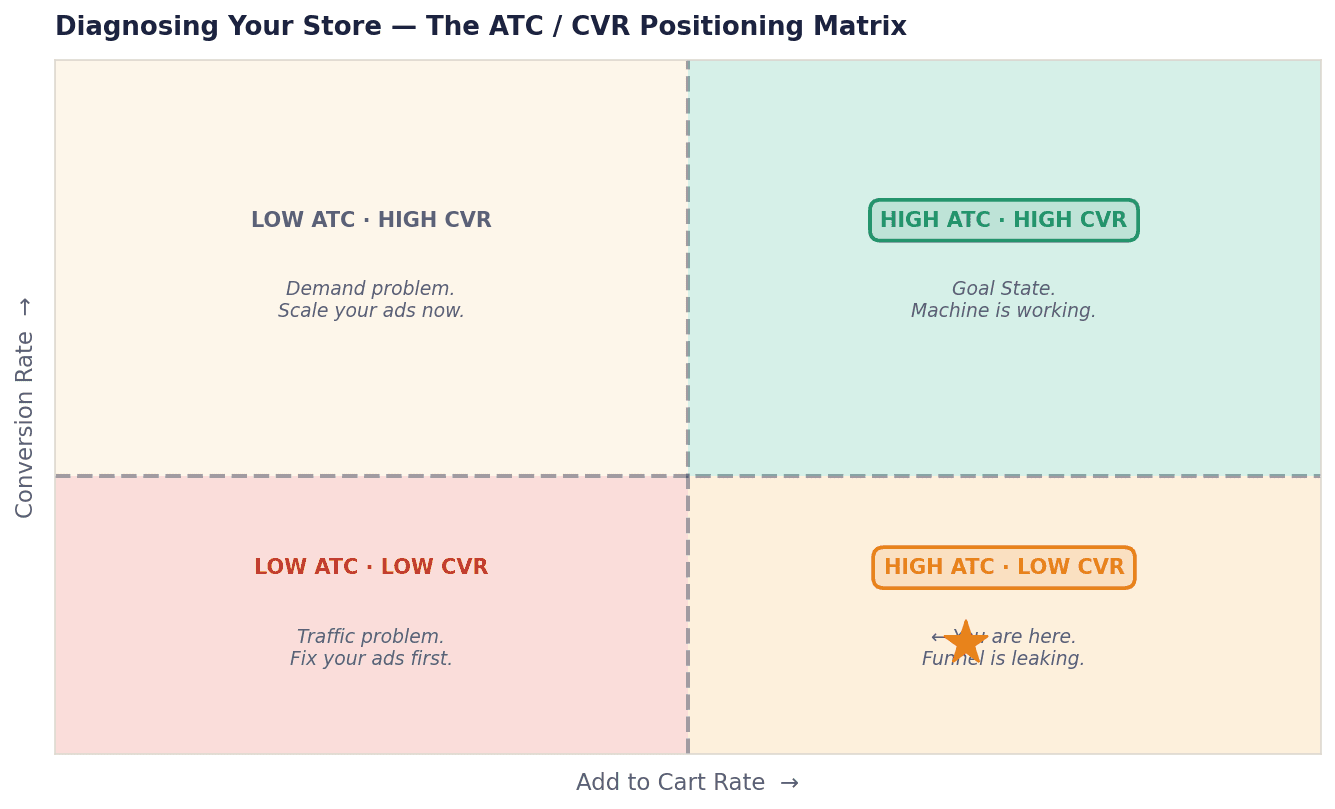
If your ATC rate increased by 40% but your revenue did not move, you do not have a demand problem.
You have a conversion problem. The desire exists. The barrier is somewhere between the cart and the confirmation email.
Your job is to find and eliminate that barrier — not to drive more traffic.
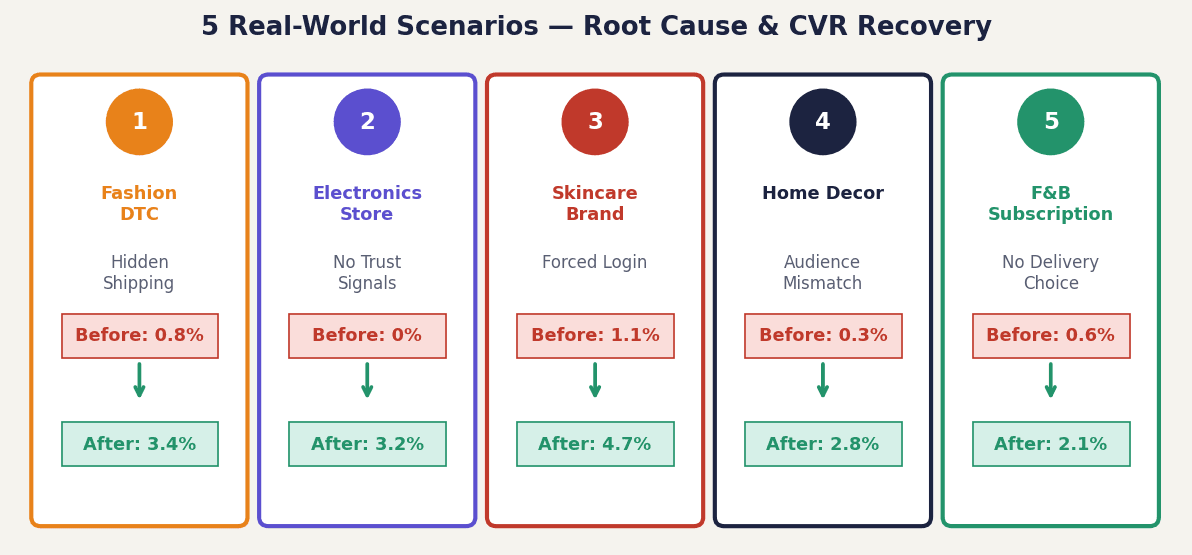
The following scenarios are composite examples built from common patterns seen across DTC, fashion, electronics, and service-based ecommerce brands.
Scenario 1: Fashion DTC Brand — The Hidden Shipping Problem
Issue
High ATC rate (8%) on a Rs. 599 dress. Conversion rate: 0.8%.
Symptoms
Customers add 1-3 items to cart, then drop off before checkout initiation. GA4 shows 80% exit at cart review page.
Root Cause
Shipping fee of Rs. 149 added at cart, representing 25% of the product price. Customers felt deceived. The product was no longer perceived as affordable.
Fix Applied
Shifted to free shipping (baked into product price, raised to Rs. 699). ATC-to-purchase rate improved from 10% to 34% within 30 days.
Scenario 2: Electronics Accessories Store — Trust Desert
Issue
New store with heavy Facebook ads driving traffic. ATC rate 6%, sales: zero for 14 days.
Symptoms
Users spent 2-4 minutes on product pages, added items, visited homepage, then left. Heatmaps showed heavy scrolling to footer while checking trust signals.
Root Cause
No reviews, no About page, no return policy, no recognizable payment icons, and a generic Shopify theme. It looked risky to first-time buyers.
Fix Applied
Added 200+ reviews, wrote brand story, added 30-day return badge, SSL indicator, and payment icons. Launched retargeting to ATC audience. First sale on day 16. CVR reached 3.2% by day 30.
Scenario 3: Skincare Brand — Checkout Complexity Killer
Issue
Warm audience retargeting campaign. ATC rate 12% (excellent). CVR: 1.1% (weak).
Symptoms
Checkout abandonment rate 91%. Users reached checkout but did not complete. Session recordings showed exits at the account-creation screen.
Root Cause
Checkout required account creation. Email verification added around 3 minutes. On mobile, forms were not keyboard-optimized, causing repeated mis-taps.
Fix Applied
Enabled guest checkout. Removed email verification from purchase flow (moved post-purchase). Set keyboard types per field. CVR rose to 4.7%.
Scenario 4: Home Decor Store — Marketing-Funnel Mismatch
Issue
Influencer campaign drove 40,000 sessions in one week. ATC rate jumped to 10%. Sales: 18 orders.
Symptoms
Bounce rate 71%. ATC sessions shorter than 90 seconds. Users did not scroll past the first image. Return visitor rate was near zero.
Root Cause
Audience skewed 18-24 while products were premium home decor priced Rs. 2,500-8,000+. Desire existed, but purchasing power and relevance were low.
Fix Applied
Rebuilt influencer brief for 28-40 lifestyle creators. Shifted budget to lookalike audiences based on purchasers. Conversion stabilized at 2.8% in the next campaign.
Scenario 5: Food and Beverage Subscription — Delivery Gap
Issue
Good reviews, good pricing, and clean checkout. ATC rate 7%. CVR 0.6%.
Symptoms
Customers completed checkout form but dropped at delivery options. Exit surveys (Hotjar) showed confusion around delivery dates.
Root Cause
Fixed delivery schedule (1st and 15th). No date selection option. Mid-month visitors saw 12+ day waits and no express path.
Fix Applied
Added "Choose your first delivery date" selector and express delivery at Rs. 99 premium. Clear delivery communication reduced confusion. CVR increased to 2.1%.
Section 4: Core Reasons Behind High ATC But Low Sales
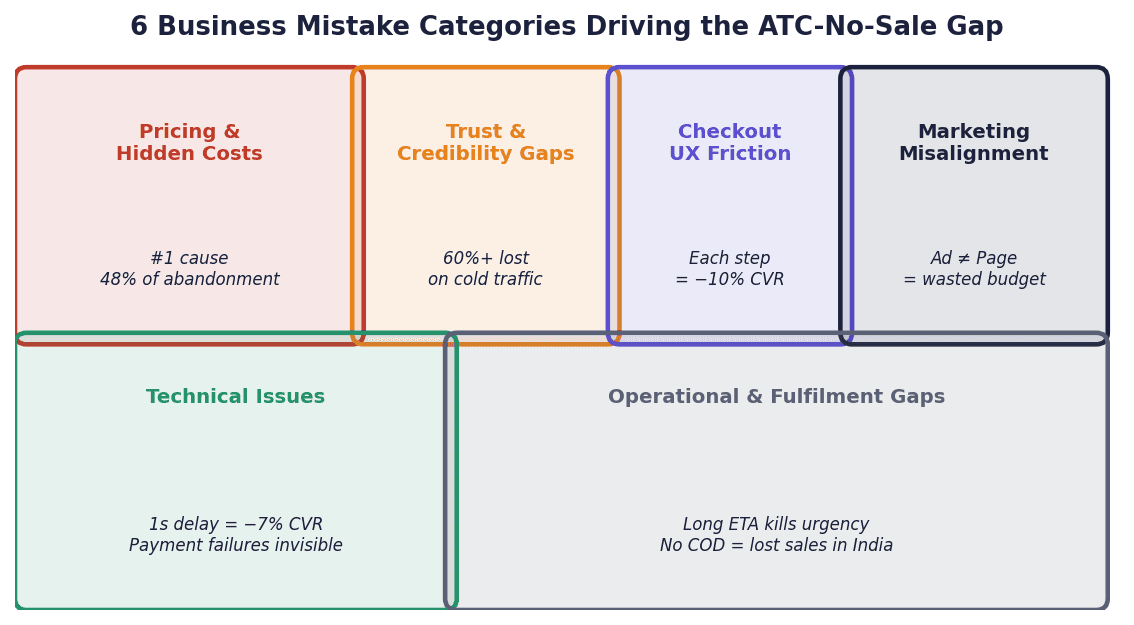
4.1 Pricing and Hidden Cost Shock
Hidden costs are one of the biggest abandonment drivers.
Shipping appears too late
Import duties/taxes are discovered at checkout
Service or handling fees appear after ATC
International users face currency surprises
4.2 Trust and Credibility Gaps
Weak security/trust signals on checkout
Low-quality or missing social proof
Unclear return/refund policies
No visible payment credibility signals
4.3 Checkout UX Friction
Forced account creation
Too many fields and steps
Limited payment options
Poor mobile form experience
Generic payment error messaging
4.4 Marketing Misalignment
Ad promise does not match landing page
Audience intent and product fit mismatch
Offer mismatch between ad and checkout reality
Creative quality vs product reality gap
4.5 Technical and Performance Issues
Slow load speed on mobile
Payment timeout/failure spikes
Inventory sync issues
Session/cart reset bugs
Coupon logic failures
4.6 Operational and Fulfilment Gaps
Delivery timelines too long
No express option where urgency is high
COD/payment preference mismatch by market
Weak pre-purchase support visibility
Section 10: Diagnostic Framework and Action Plan
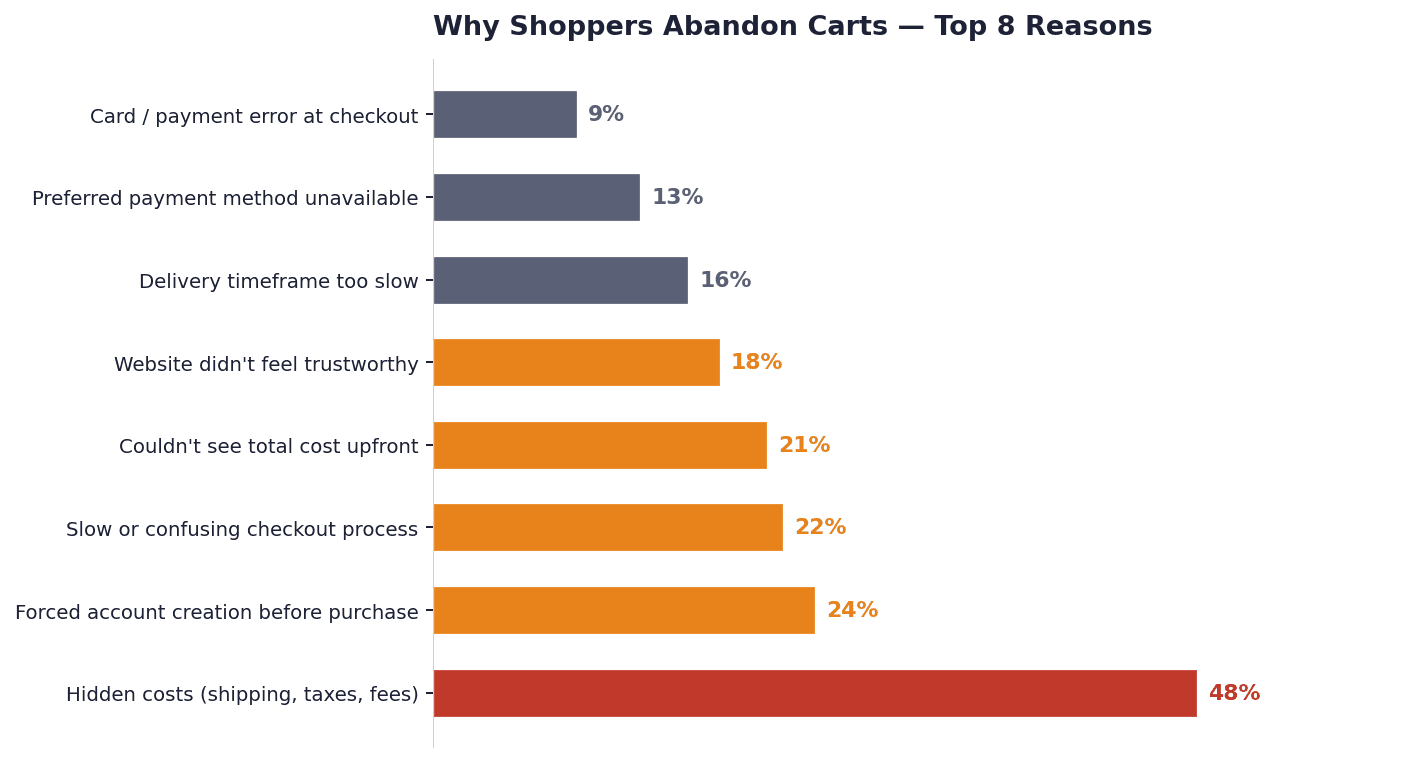
Use this framework to systematically diagnose and fix the ATC-to-no-sale gap in any ecommerce business.
Step 1: Segment Your Data
Separate ATC rate from checkout conversion rate, because they tell different stories
Segment by device (mobile vs. desktop conversions can differ sharply)
Segment by traffic source (organic, paid, social, and email abandon differently)
Segment by new vs. returning visitors (returning visitors should convert significantly higher)
Step 2: Map the Drop-Off
Use GA4 funnel exploration to identify the exact exit step
Install session recording (Hotjar, Microsoft Clarity) on cart and checkout pages
Review payment gateway logs for failure rates and error codes
Run exit surveys; one question can reveal root causes quickly
Section 5: Inside the Buyer's Mind
Step 3: Prioritize by Impact
5.1 The Mental Journey from Browse to Buy
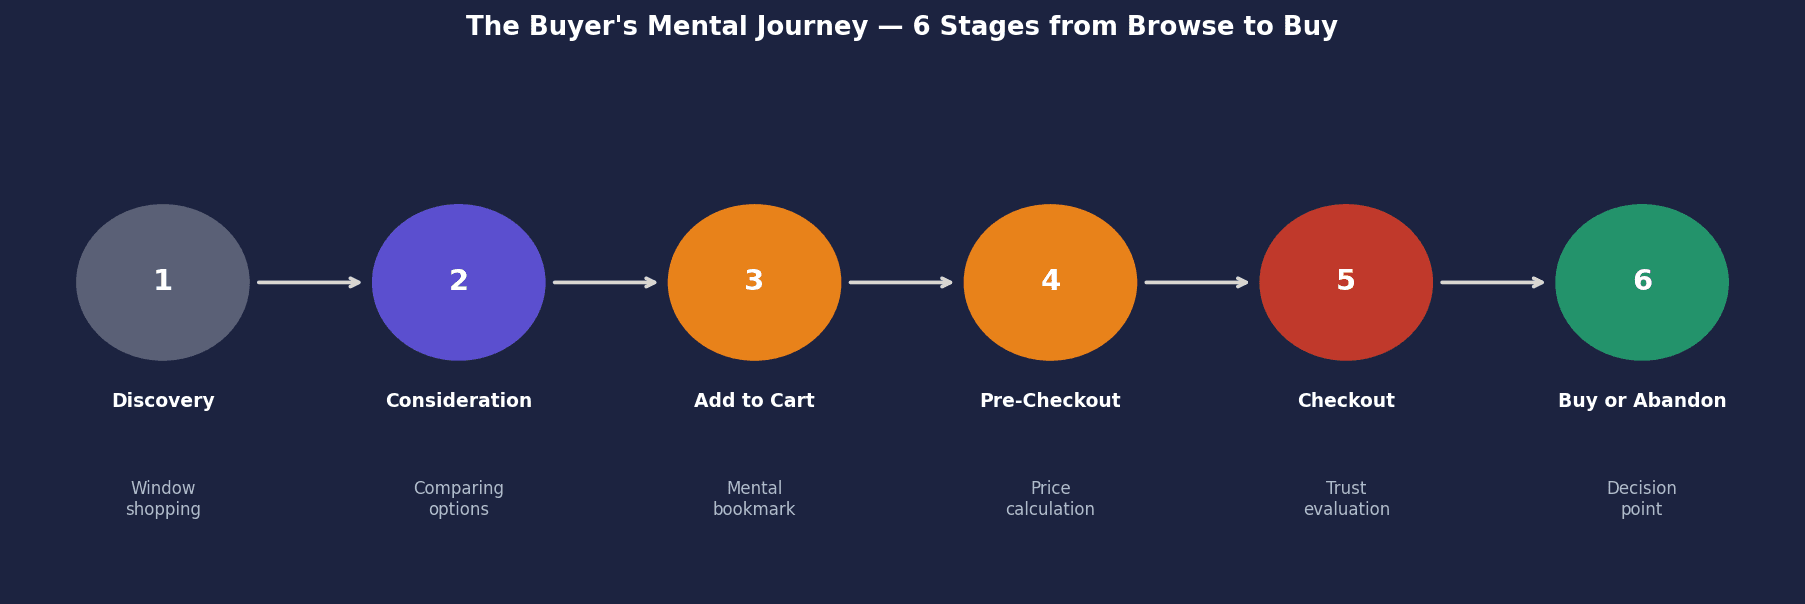
Discovery: "This looks interesting"
Consideration: comparison starts
ATC: cart becomes mental bookmark
Pre-checkout: total-cost evaluation
Checkout start: trust evaluation
Abandonment: risk and delay mindset
Recovery: external reminder reactivates intent
5.2 Psychological Triggers Behind Abandonment
Loss aversion
Decision fatigue
Reversed endowment effect
Zeigarnik effect (unfinished task memory)
FOMO vs FOMU
Price anchor shift to alternatives
Analysis paralysis
5.3 The 7 Internal Questions at Checkout
Is this the best price?
Will product match expectation?
Can I return it safely?
Is payment secure?
Will delivery be reliable?
Is this brand trusted by others?
Do I need this now?
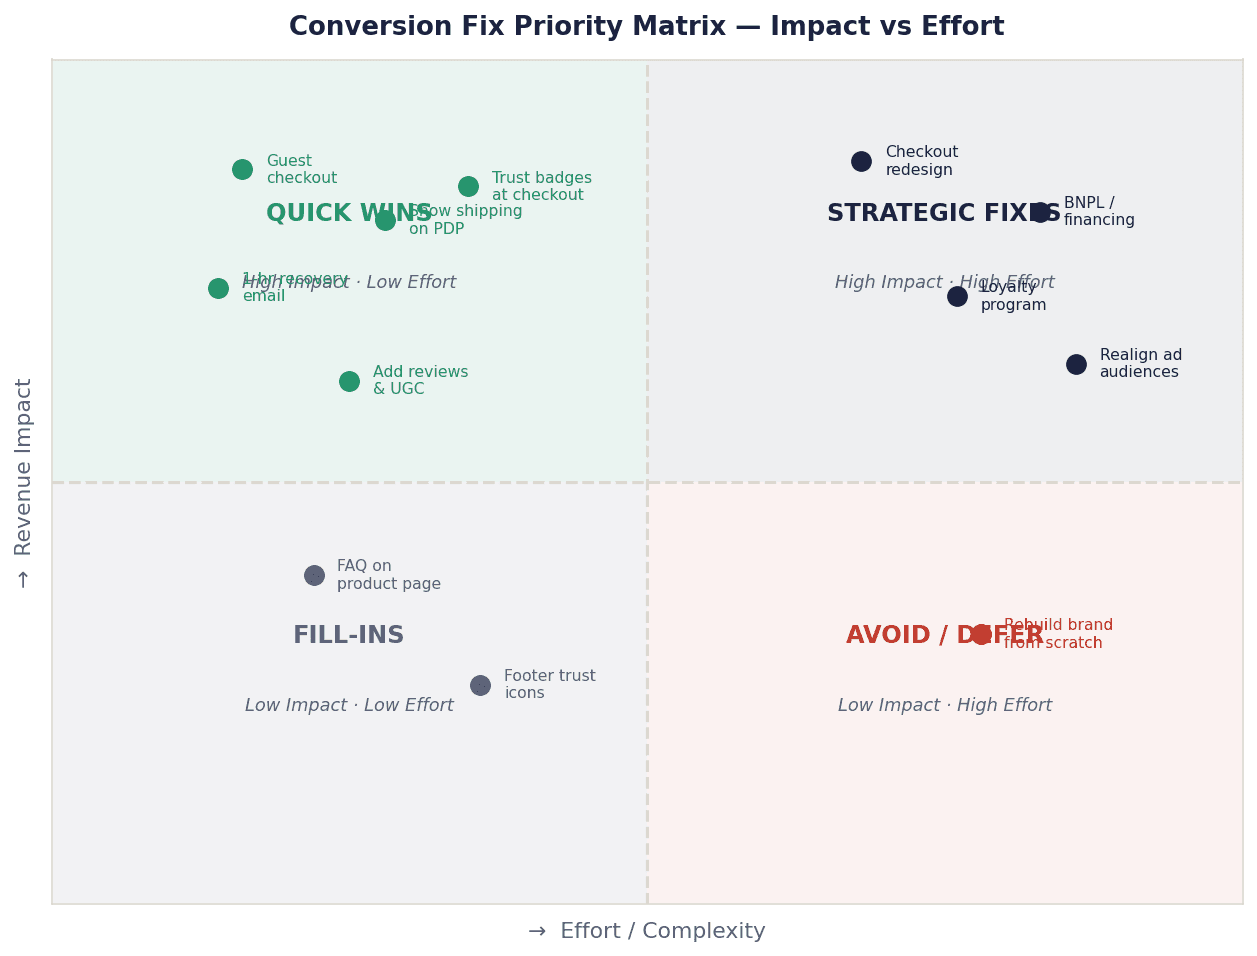
| Quick Wins (Week 1) | Medium-Term (Month 1) | Strategic (Quarter 1) |
|---|---|---|
| Enable guest checkout | Full cart recovery email sequence (3-email) | Rebuild checkout UX from scratch |
| Show shipping cost on product page | Add product reviews and UGC | Integrate BNPL / financing options |
| Add trust badges to checkout | Mobile checkout optimization | Implement loyalty / repeat purchase program |
| Set up 1-hour cart recovery email | Add SMS recovery channel | Build post-purchase referral loop |
| Add payment method logos | A/B test free shipping thresholds | Audit and realign marketing audiences |
Quick Wins (Week 1):
Enable guest checkout
Show shipping cost on product page
Add trust badges to checkout
Set up 1-hour cart recovery email
Add payment method logos
Medium-Term (Month 1):
Full cart recovery email sequence (3-email)
Add product reviews and UGC
Mobile checkout optimization
Add SMS recovery channel
A/B test free shipping thresholds
Strategic (Quarter 1):
Rebuild checkout UX from scratch
Integrate BNPL / financing options
Implement loyalty / repeat purchase program
Build post-purchase referral loop
Audit and realign marketing audiences
Section 6: Business Mistakes That Create the ATC-No-Sale Gap
Section 11: Summary — The Core Truth
6.1 Strategy-Level Mistakes
Tracking ATC as success instead of revenue efficiency
Scaling traffic before fixing post-ATC leakage
Testing PDP only, ignoring checkout stage
No recovery system for abandoners
Same message for all abandoners regardless of cause
6.2 Product Page Mistakes
SEO-heavy copy with weak buyer clarity
Weak product proof (photos/video/use-case)
Missing FAQ and objection handling
Scarcity/urgency messaging that harms trust
6.3 Post-Abandonment Mistakes
No email or SMS recovery sequence
Generic recovery messaging
Early discounting that trains abandonment behavior
One-touch follow-up instead of sequenced recovery
The Fundamental Insight
High Add to Cart with no sales is not a demand problem. It is a conversion architecture problem.
Your customer has already done the hard work of wanting your product. They raised their hand.
Your store, checkout, messaging, or operations then talked them out of it.
Every abandoned cart is a customer who was ready to say yes and you accidentally taught them to say no.
The fix is not more traffic. The fix is removing the barriers that exist between intent and purchase.
The brands that win in ecommerce are not the ones with the best products or the highest ad budgets. They are the ones who have engineered the shortest, most frictionless, most trustworthy path from "I want this" to "I bought this."
That path is your competitive advantage. Build it deliberately.
Section 7: Funnel Behaviour Analysis
End of Case Study
Prepared for Agency Internal Use — All Rights Reserved